SAN ANTONIO
INTELLIGENCE
PLATFORM
Real Time City Intelligence, One Dashboard.
San Antonio's first unified infrastructure awareness platform. 60+
free government data sources aggregated into a real-time
dashboard built for city leaders, emergency managers, businesses, and the citizens
of San Antonio.
Live Traffic Flow with SAPD Districts & SAFD Areas
ERCOT Grid, CPS Energy Outages & Energy Storage
Cyber Threat Intel, Police & Fire/EMS Dispatch
Weather Alerts, River Gauges & Air Quality
60+
Data Sources
14
Intel Domains
50+
Map Layers
24/7
Live Ops
Built by The AI Cowboys


Live Reports
Download Real-Time City Intelligence Reports
Generate professional 8-page intelligence briefings from 35+ live data sources. Sector assessments, threat analysis, KPIs, economic indicators, and infrastructure status — formatted and ready for leadership, city council, emergency operations, or public transparency.
UNCLASSIFIED // FOR OFFICIAL USE ONLY
Page 1 of 8
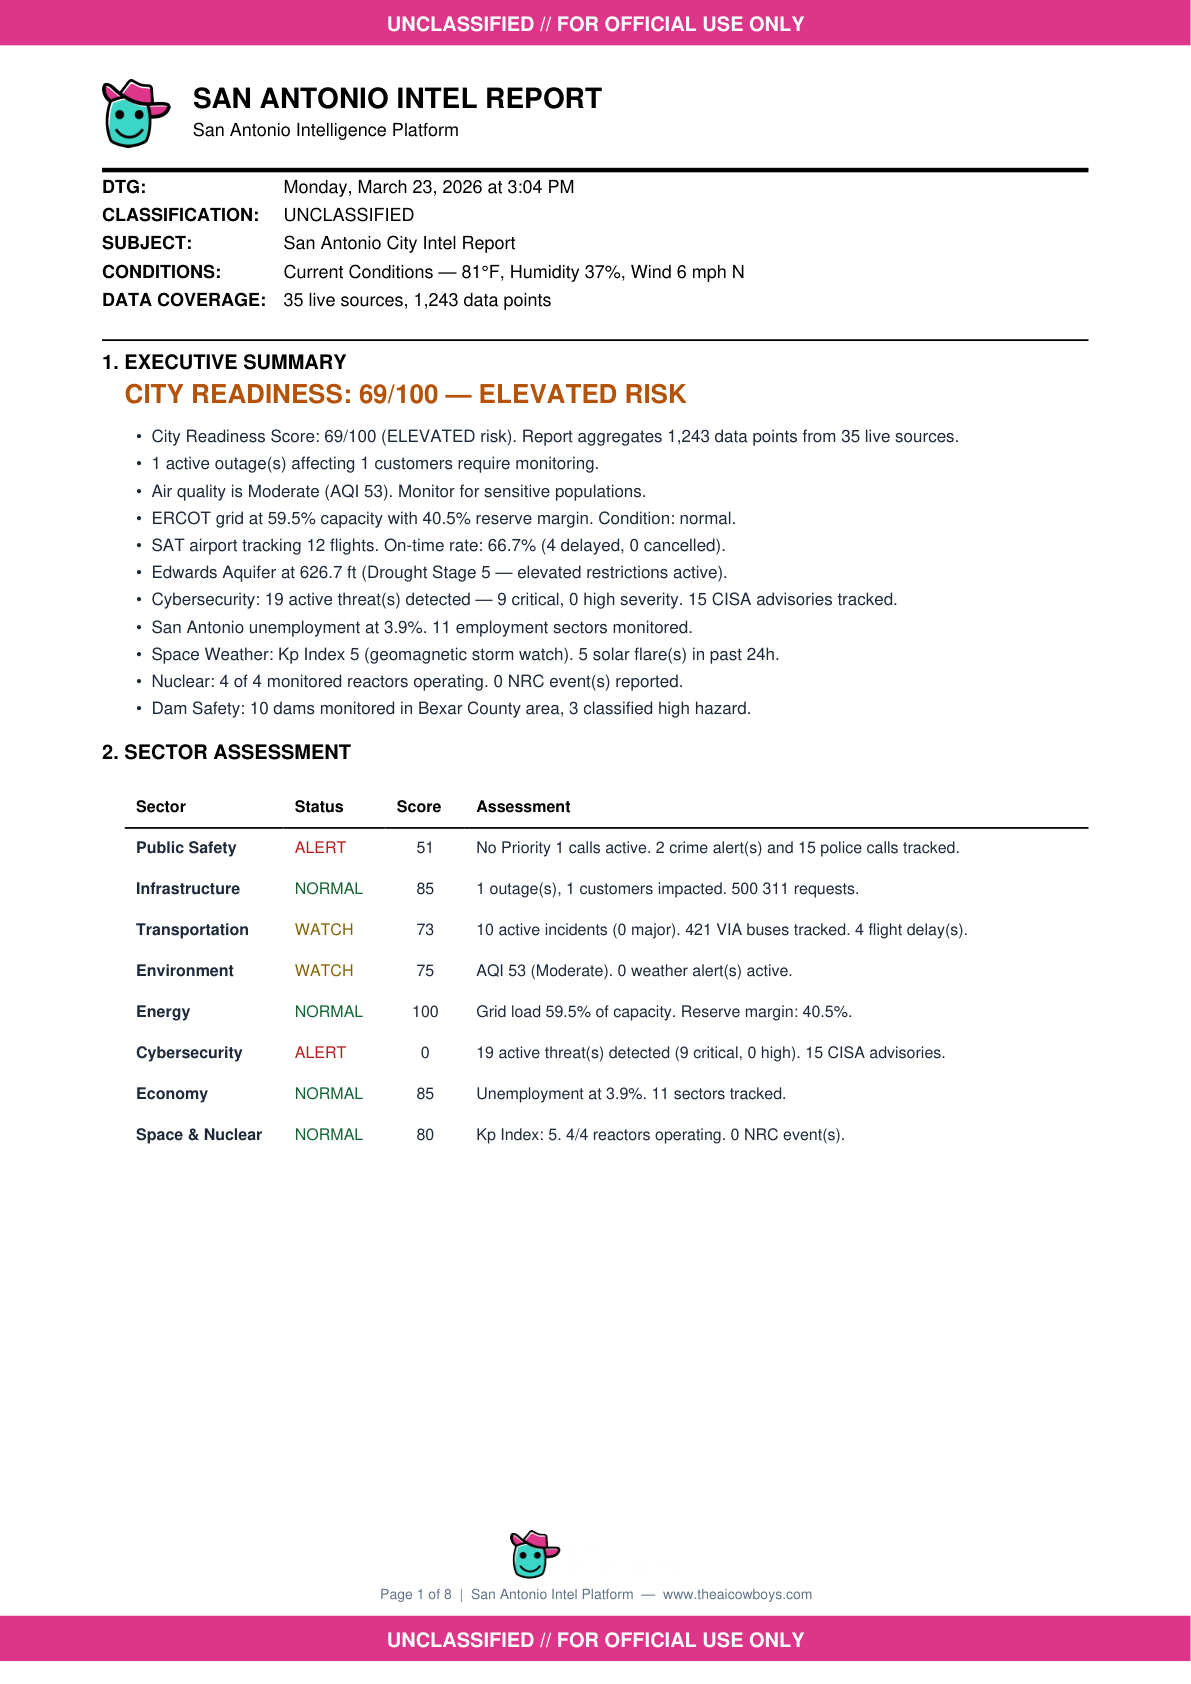
Executive Summary
City Readiness Score, sector status, and conditions overview
UNCLASSIFIED // FOR OFFICIAL USE ONLY
Page 2 of 8
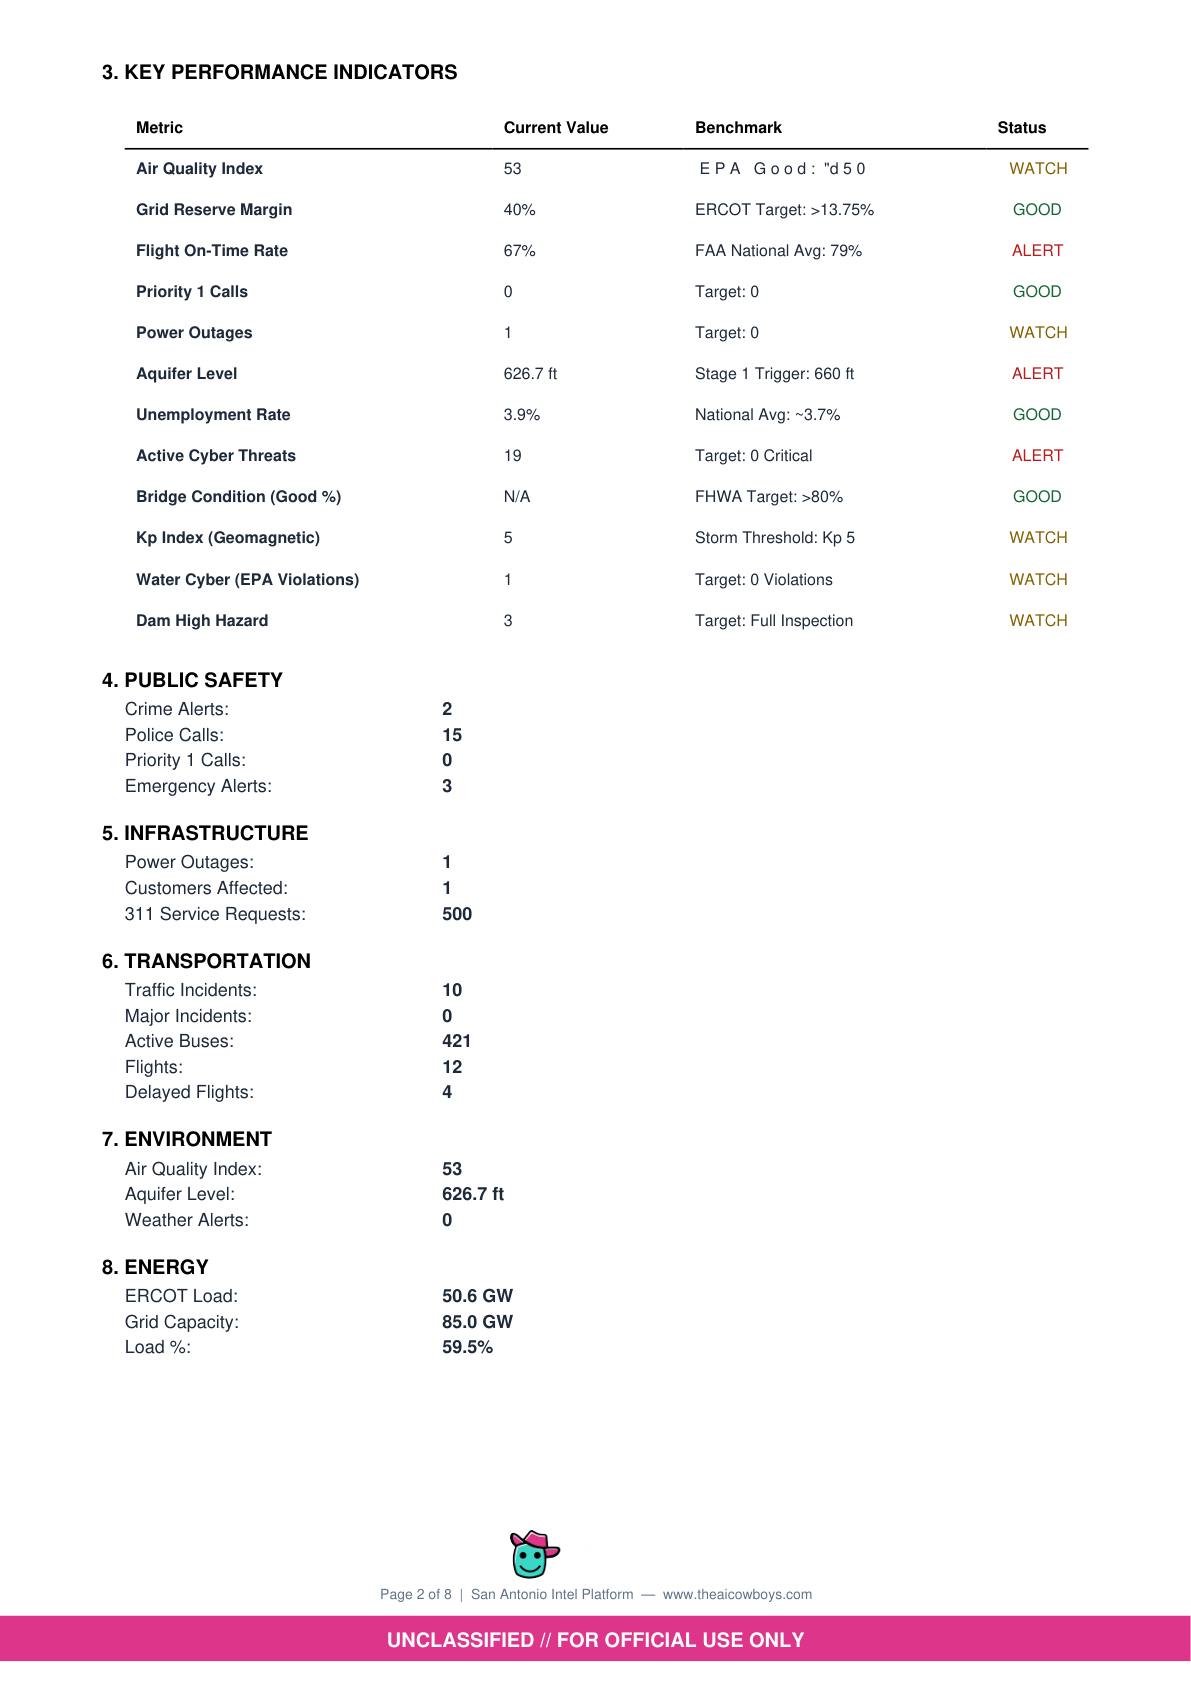
Key Performance Indicators
AQI, grid reserve, flight rates, cyber threats, aquifer levels
UNCLASSIFIED // FOR OFFICIAL USE ONLY
Page 3 of 8
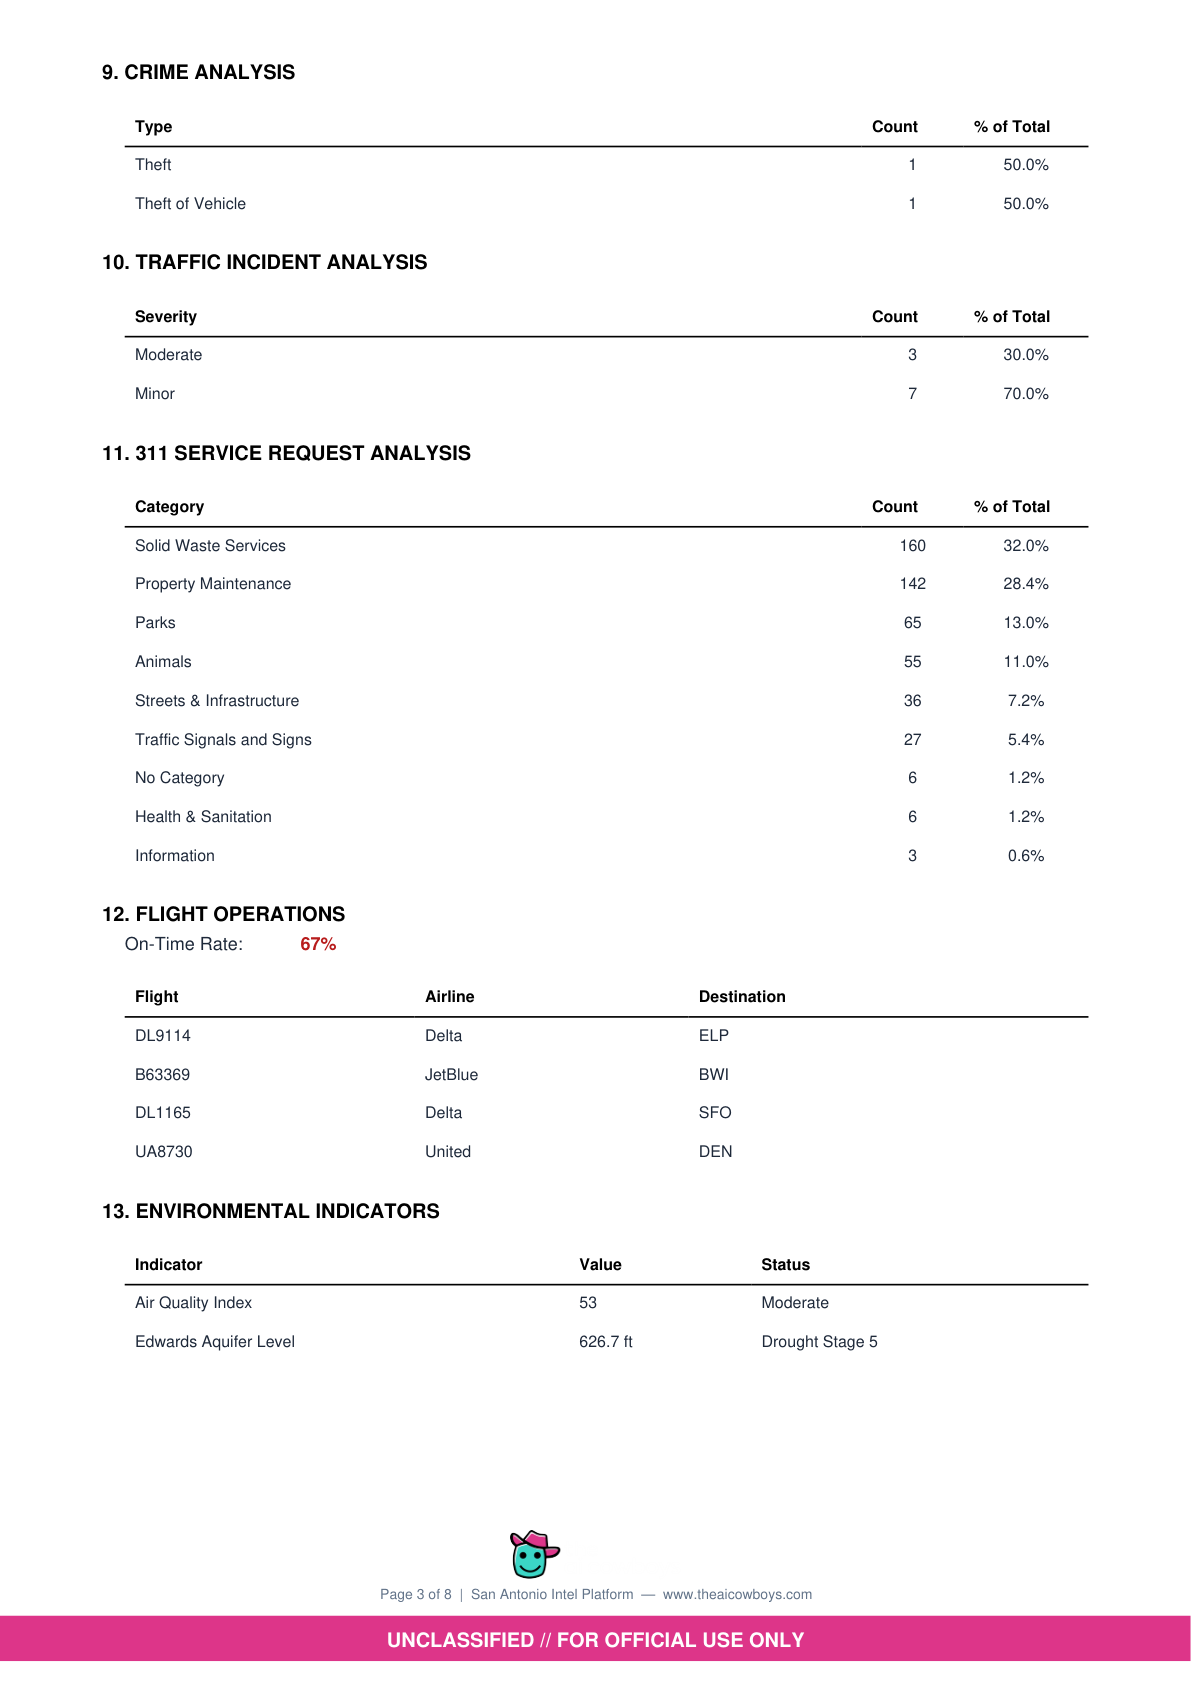
Service & Traffic Analysis
Crime, traffic incidents, 311 requests, flight operations
UNCLASSIFIED // FOR OFFICIAL USE ONLY
Page 4 of 8
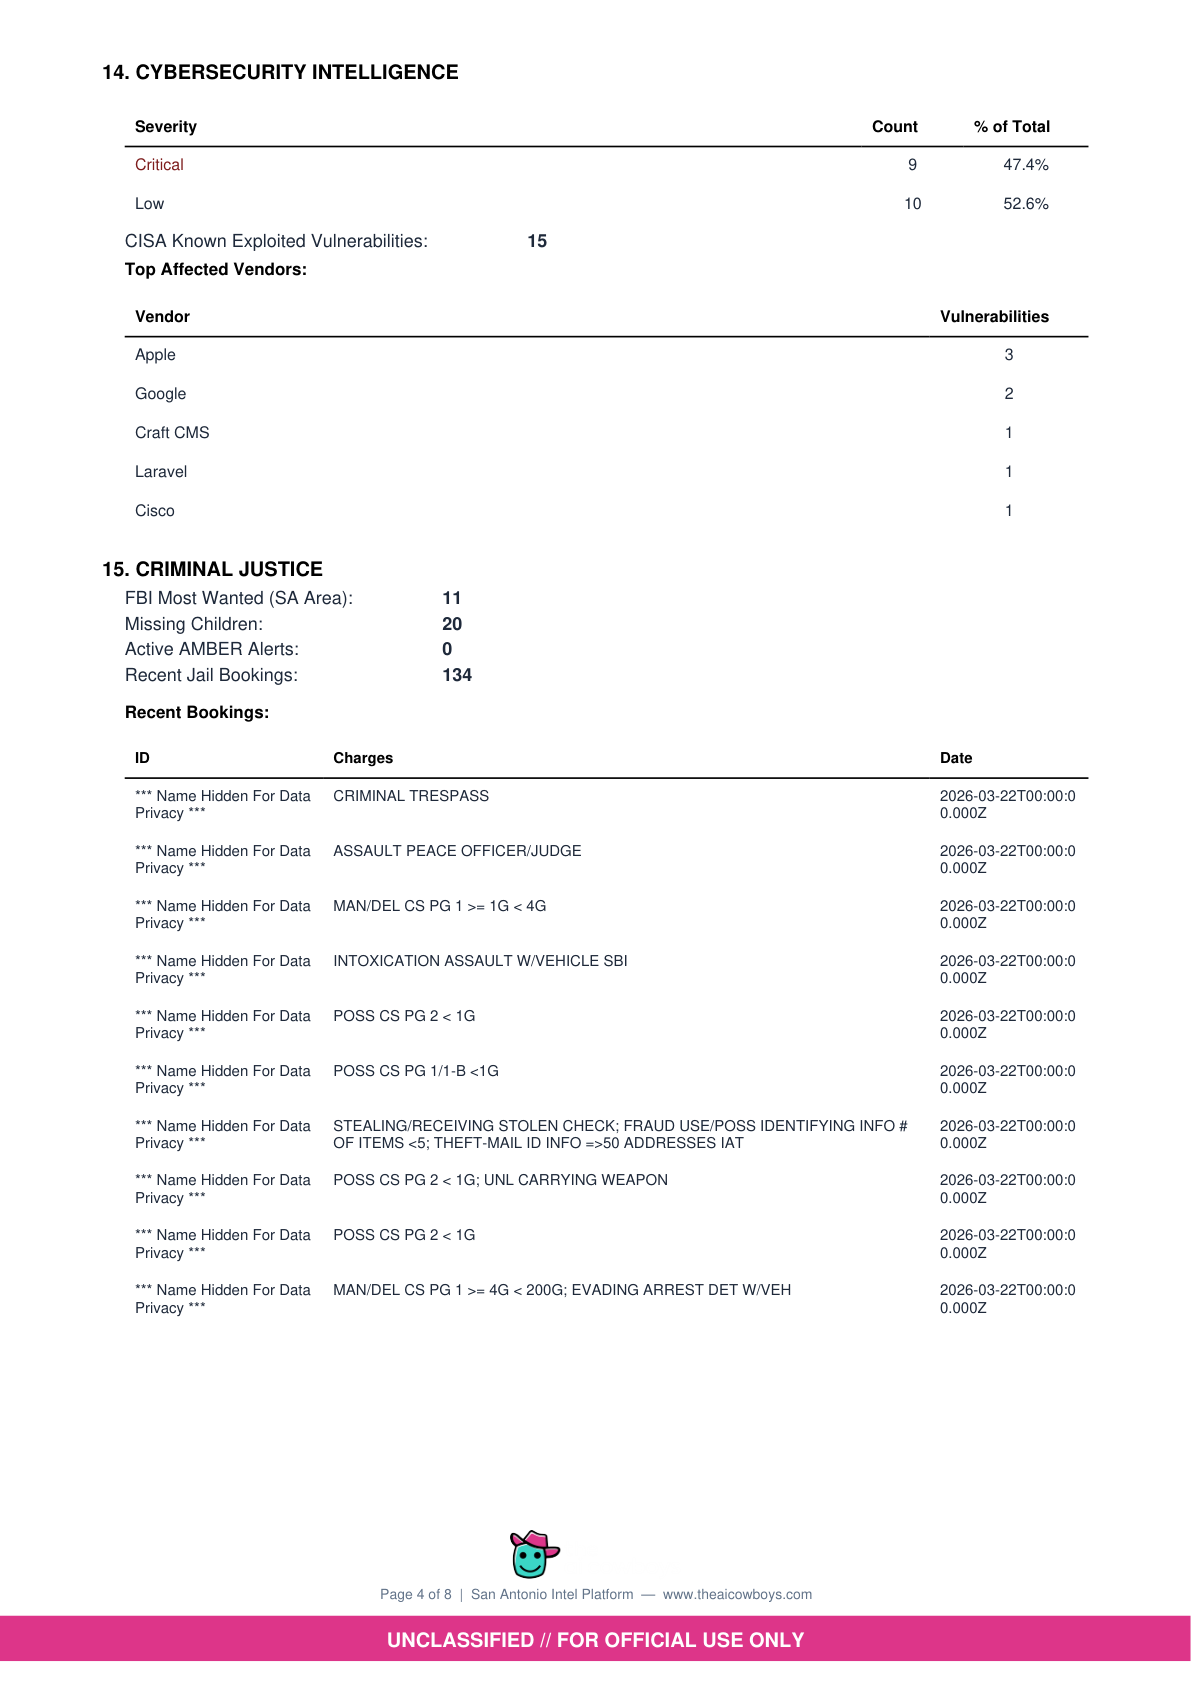
Cybersecurity & Criminal Justice
CISA KEVs, vendor vulnerabilities, jail bookings, AMBER alerts
UNCLASSIFIED // FOR OFFICIAL USE ONLY
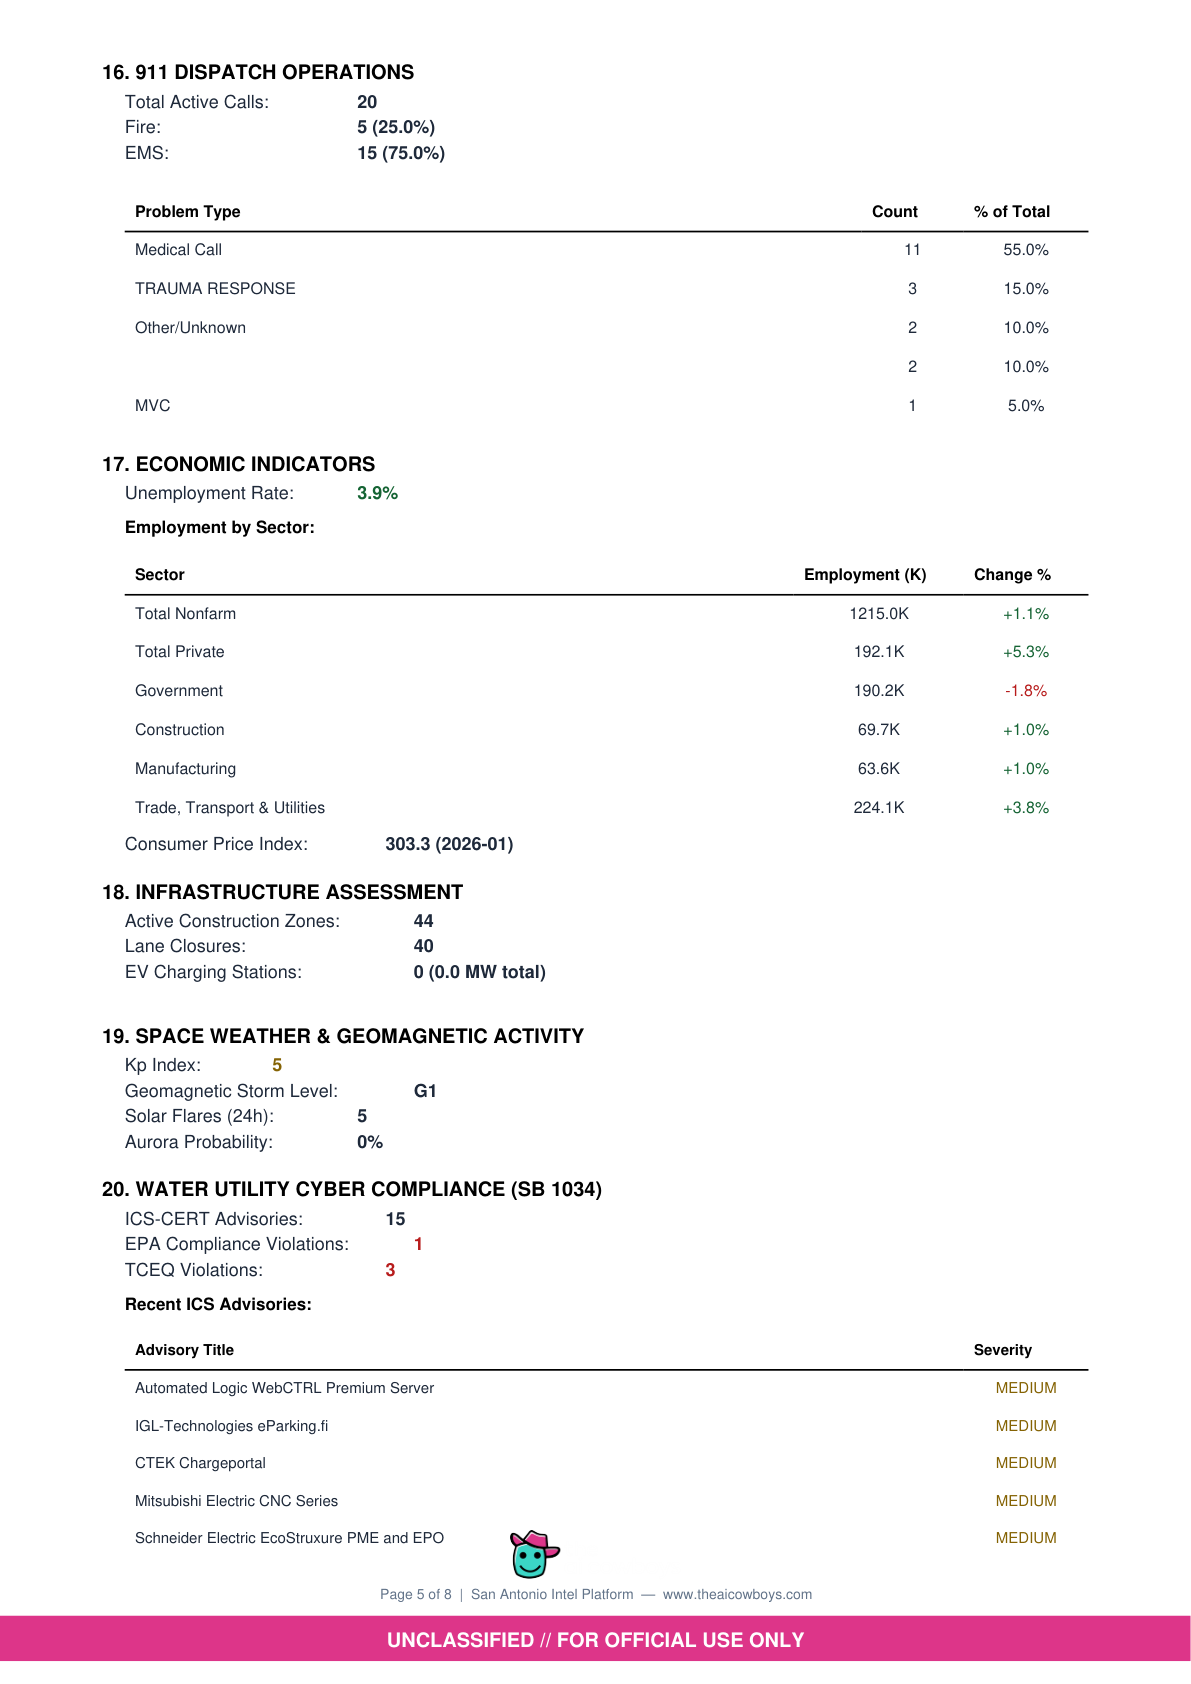
Page 5 of 8
Economic & Infrastructure
Employment sectors, ERCOT load, dam safety, nuclear status
UNCLASSIFIED // FOR OFFICIAL USE ONLY
Page 6 of 8
Food Safety & Use Cases
Health inspections by district, recommended ways to use data
UNCLASSIFIED // FOR OFFICIAL USE ONLY
Page 7 of 8
Data Freshness & Emergency Contacts
25 live data categories, update timestamps, EOC contacts
UNCLASSIFIED // FOR OFFICIAL USE ONLY

Page 8 of 8
Disclaimer & Privacy Notice
Data sourcing, PII redaction policy, and legal notice
UNCLASSIFIED // FOR OFFICIAL USE ONLY
Page 1 of 8
Executive Summary
City Readiness Score, sector status, and conditions overview
UNCLASSIFIED // FOR OFFICIAL USE ONLY
Page 2 of 8
Key Performance Indicators
AQI, grid reserve, flight rates, cyber threats, aquifer levels
UNCLASSIFIED // FOR OFFICIAL USE ONLY
Page 3 of 8
Service & Traffic Analysis
Crime, traffic incidents, 311 requests, flight operations
UNCLASSIFIED // FOR OFFICIAL USE ONLY
Page 4 of 8
Cybersecurity & Criminal Justice
CISA KEVs, vendor vulnerabilities, jail bookings, AMBER alerts
UNCLASSIFIED // FOR OFFICIAL USE ONLY
Page 5 of 8
Economic & Infrastructure
Employment sectors, ERCOT load, dam safety, nuclear status
UNCLASSIFIED // FOR OFFICIAL USE ONLY
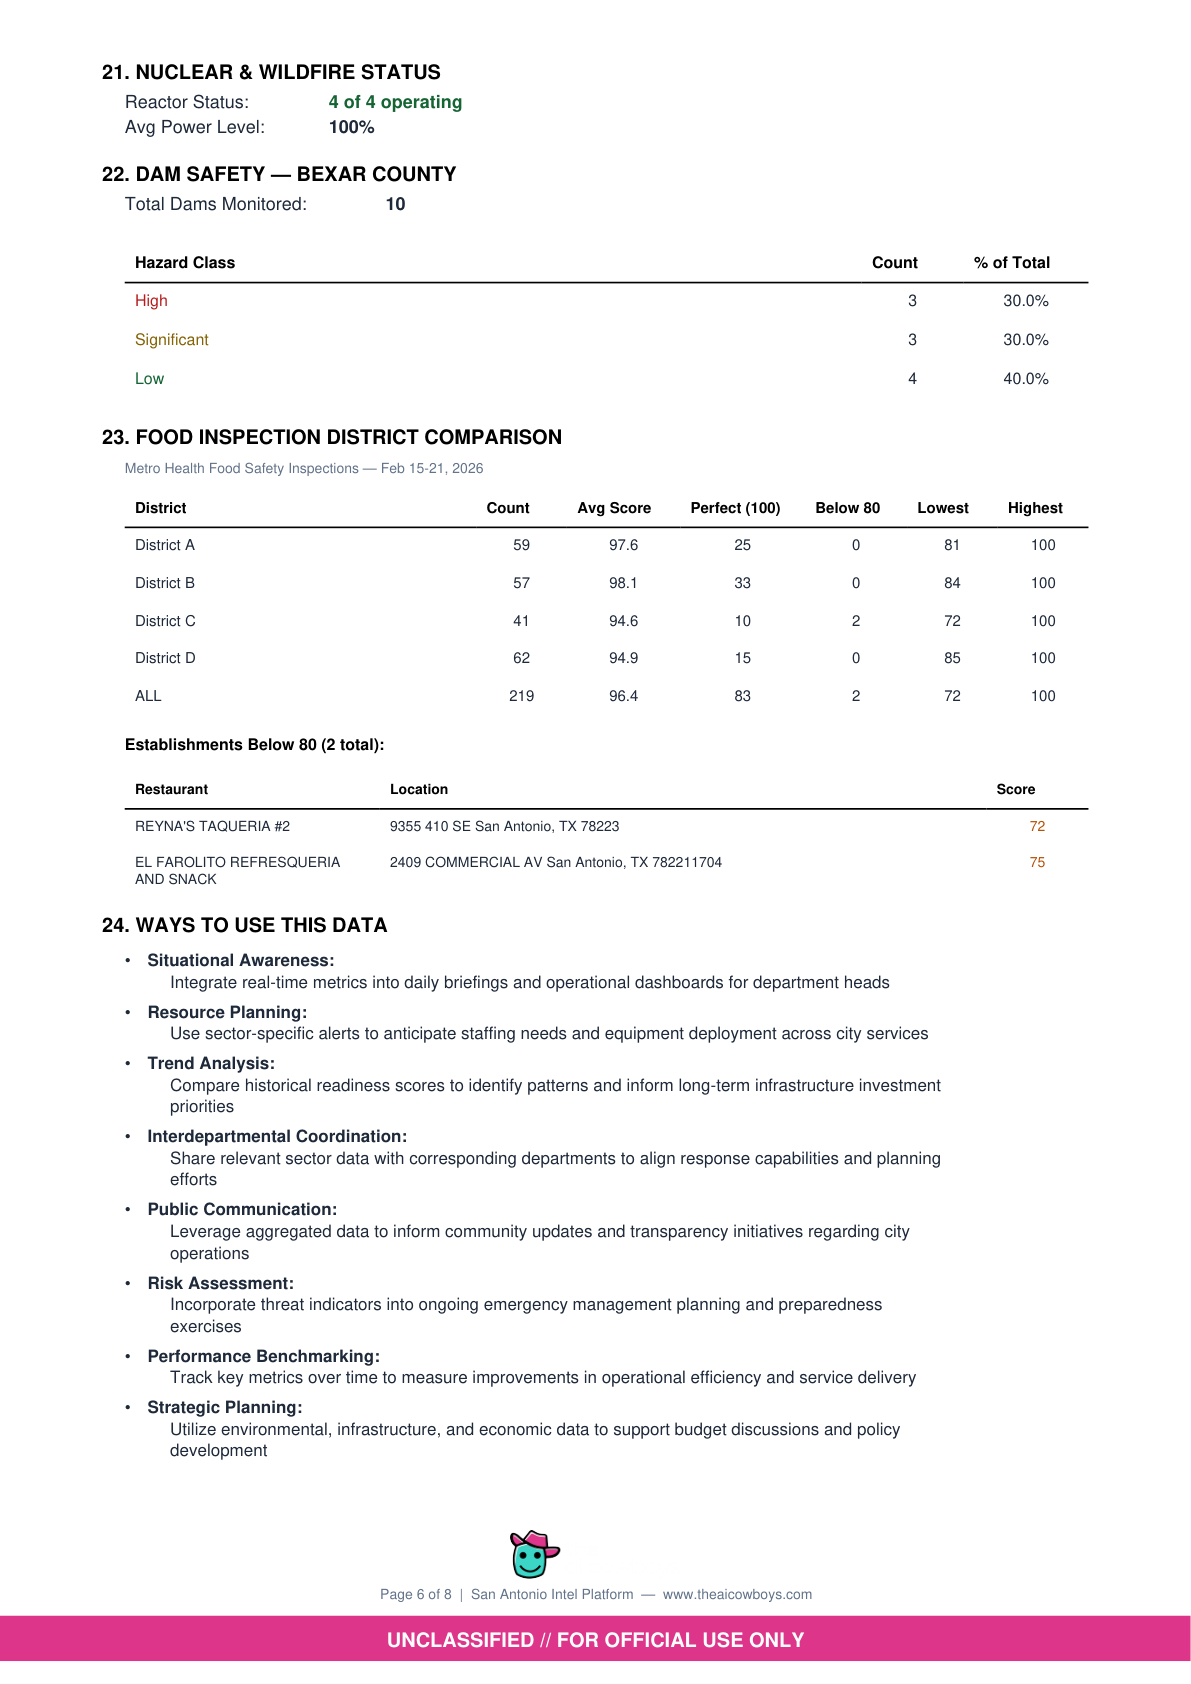
Page 6 of 8
Food Safety & Use Cases
Health inspections by district, recommended ways to use data
UNCLASSIFIED // FOR OFFICIAL USE ONLY
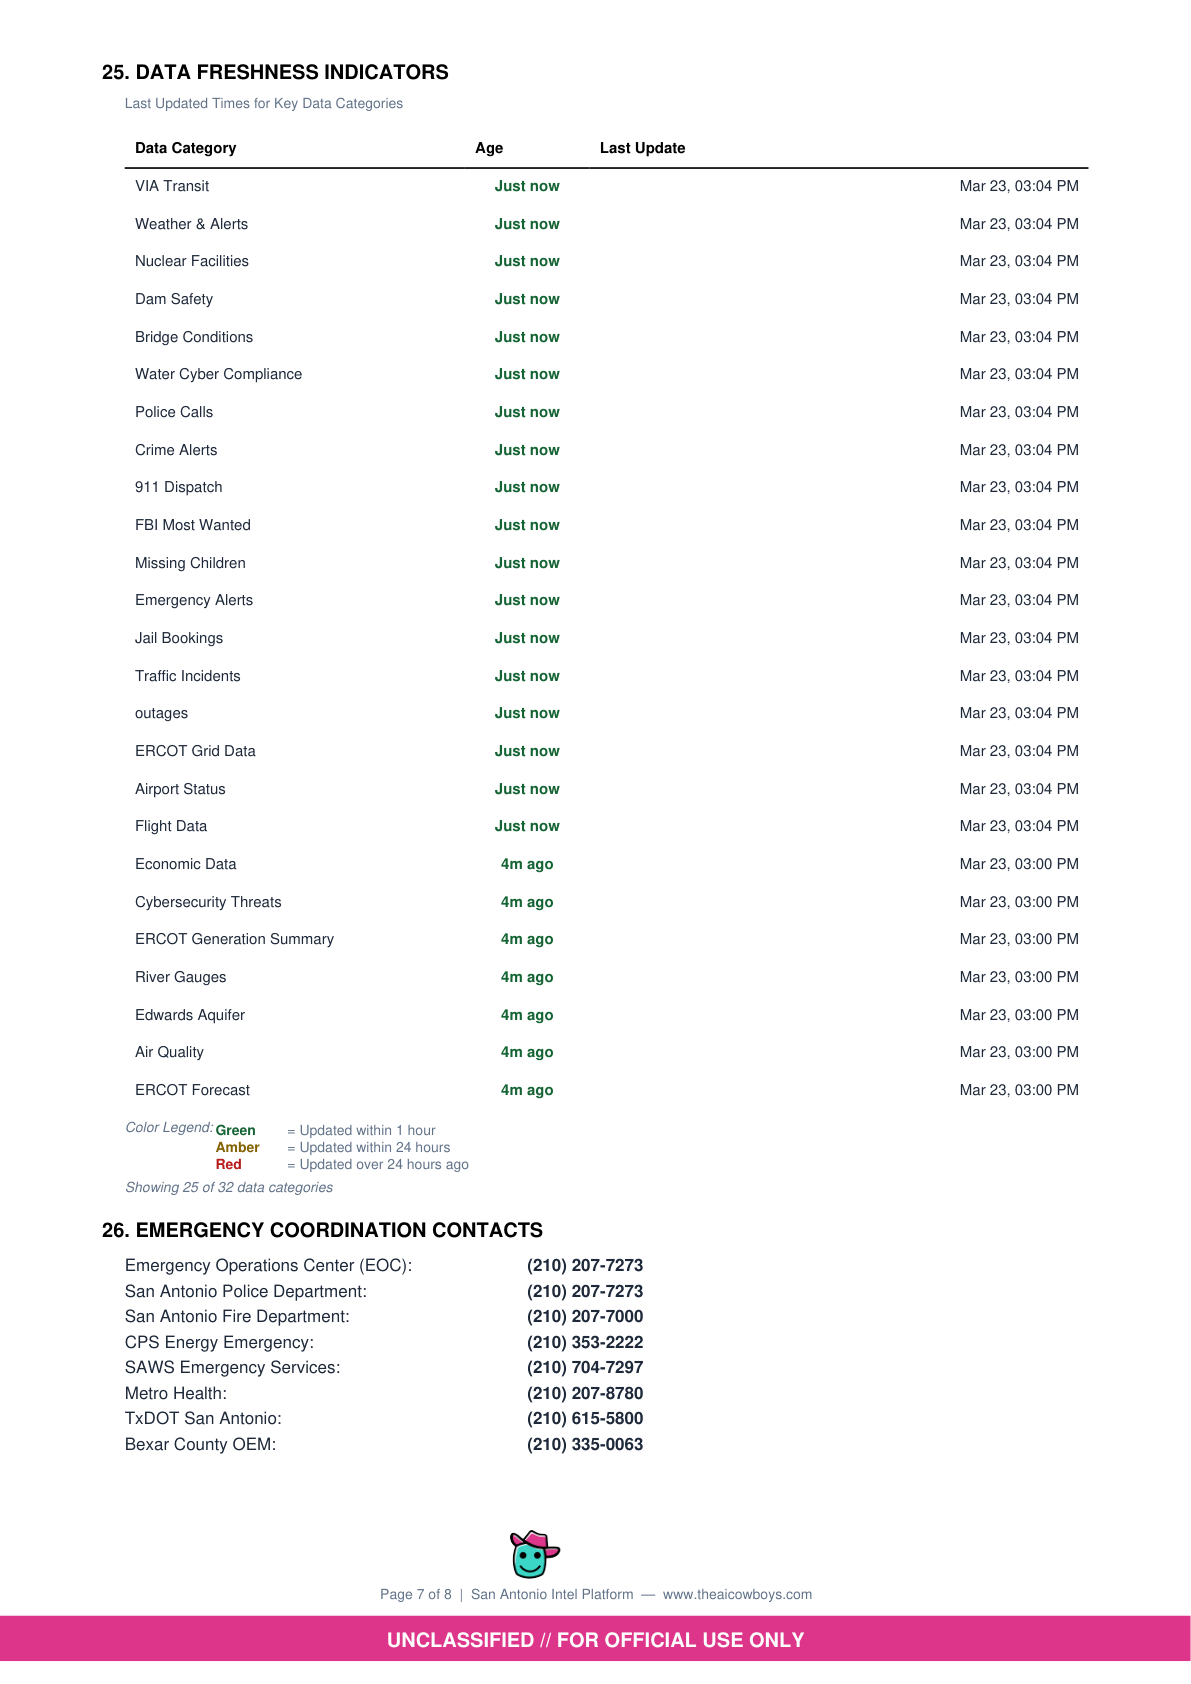
Page 7 of 8
Data Freshness & Emergency Contacts
25 live data categories, update timestamps, EOC contacts
UNCLASSIFIED // FOR OFFICIAL USE ONLY
Page 8 of 8
Disclaimer & Privacy Notice
Data sourcing, PII redaction policy, and legal notice
💡 Why These Reports Matter
Eliminate Data Silos
City leaders currently check 12+ separate websites to build a situational picture. This report aggregates ERCOT, NWS, CISA, TxDOT, USGS, SAWS, and 29 other sources into a single document in under 5 seconds.
Real-Time, Not Stale
Every report is generated live — not from cached or weekly data. The Data Freshness page shows exactly when each of the 25 data categories was last updated, most within the last minute.
Accountability & Transparency
Every download is logged with user, timestamp, and document type. Reports are built entirely from free, public government data — ensuring full transparency with zero editorial alteration.
Scored & Assessed
Each sector receives a readiness score and status (NORMAL / WATCH / ALERT). The City Readiness Score rolls up all 8 sectors into a single number — making it impossible to miss a developing crisis.
🔧 How to Use These Reports
Daily Briefings
Start every morning with a fresh report. City managers, department heads, and emergency coordinators get an instant operational picture without checking a single external website.
Council & Board Presentations
Drop the 8-page PDF into any council meeting, CPS Energy board session, or SAWS briefing. Professional formatting with sector scores, KPIs, and trend data — no slides needed.
Emergency Operations
During severe weather, grid stress, or infrastructure incidents, generate a report to capture the exact state of all city systems at that moment. EOC contacts are included on every report.
Trend Analysis & Planning
Download reports daily or weekly to track employment trends, crime patterns, infrastructure aging, and cyber threat evolution over time. Use historical comparisons to inform budget and policy decisions.